During the second week of the course, Introduction to advanced geoinformatics, we have read and discussed big data, data-driven geography and started using the Structured Query Language, SQL. Since big data and data overall have been on the tapestry this week, we have especially focused on the quality of the data. Data quality is vital for every analysis and task, imprecise and inaccurate data can change and affect the analysis negatively which makes data exploration very important.
This week’s exercise was to explore data, using SQL queries and assess data quality. The data I worked with, was location-based Flickr data containing information about users, photos, and activity on Flickr posts in the Helsinki region.
Table 1. A table with basic statistical information about the Flickr database. In the table, there are listed all the values of the statistics and the queries used to collect the values.
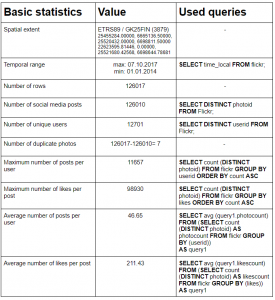
The first part of the assignment was to collect basic statistical values from the Flickr database. To do this, I used different SQL queries in the PostGIS application in QGIS. In the table above (table 1.), I have listed all the queries I used and the statistical results that the queries gave.
After I had collected the statistical values, I exported the Flickr database to a QGIS project. The database showed locations of Flickr posts on the map in QGIS. I visualized a point pattern map, to display the locations of Flickr posts in the Helsinki region. The locations of the posts are scattered around in the Helsinki region, with a concentration within the highway ring III.
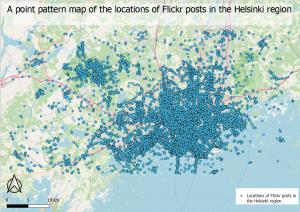
Picture 1. The map shows all the separate locations of Flickr posts in the Helsinki region.
I also visualized a heatmap of the Flickr database that shows the concentration of Flickr posts’ location in the Helsinki region. According to the point pattern map and the heatmap, the vast majority of the 126 010 posts are located in the centre of Helsinki.
The popular tourist hubs, Helsinki Cathedral, market square Helsinki and Suomenlinna are hotspot locations for Flickr posts, according to the heatmap. Also, Pasila, with Messukeskus, Linnanmäki and Hartwall arena as well as Töölö, with Helsinki Ice Hall and The Olympic Stadium are popular places for Flickr posts. Tapiola and Matinkylä are places with a rather high amount of Flickr posts while most of Espoo and Eastern Helsinki are places that have a smaller amount of posts. Nuuksio National Park and the Helsinki-Vantaa airport are distinct places outside the highway ring III, which are locations for Flickr posts although in a small amount.
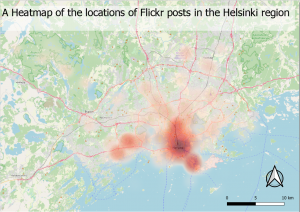
Picture 2. The map shows both hotspots, where there are the highest concentrations of Flickr posts as well as locations, with a less concentration of posts.
After I had visualized a point pattern map and a heatmap of the database, I continued the task by combining the Flickr database with a grid polygon with the size of 500x500m. This was a challenging process, as it was hard to figure out the exact query to combine those two. After trying for about an hour, I got help from the instructor who helped me solve the query. In the table below, the query is listed which I used when aggregating the data.
Table 2. The table shows the query I used to aggregate the Flickr database and the grid polygon 500x500m.

When I finally got the database and the grid combined, I visualized the result as a thematic map. Because of the wide differences between the concentrations of posts’ geographical locations, the classifications of the thematic map were a bit tricky. As I earlier mentioned, most of the posts’ locations were in the centre of Helsinki while surrounding areas had a much smaller concentration of posts. This made the classification of the thematic map rough because there were places with few posts and places with many thousands of posts.
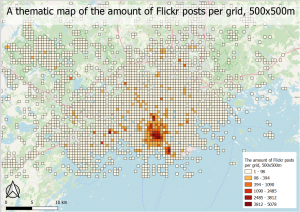
Picture 3. A thematic map of the aggregated data, that shows the amount of Flickr posts per grid 500x500m
The last part of the task was to choose a specific location in Helsinki and check the accuracy of the location in the posts. I chose Korkeasaari Zoo as my location and made the analysis twice, once with the Flickr database and once with the Instagram database. I used a string of queries to extract all the locations that mentioned the word “Korkeasaari” in the posts’ text description, and those posts’ latitude and longitude as well as their geometry. This formed a new layer with points representing the location of each post that somehow was connected to the word “korkeasaari”. The queries I used to extract the specific locations are listed below in the table.
Table 3. A table that shows the queries I used, to extract all the location points that had the word “korkeasaari” in the text description.

Just because a specific location or place is mentioned in a post on a social platform, it does not necessarily mean that the post is from that exact location. The reasons for this can be many. When analyzing results from large databases with the help of queries, that aren’t specific enough, it’s important to acknowledge the fact that the results can possess places that aren’t relevant for the analysis. Different geographical places can have the same names, which can make analyses based on names or words vague.
It was interesting to see how the results varied significantly between Flickr and Instagram databases. The Instagram database had a lot more points that were connected to the statement word ‘%Korkeasaari%’than Flickr database had. The map below (picture 4.) shows Flickr posts locations and distance layers. Almost all points are on the actual Korkeasaari Zoo island while one point is on another island, also called Korkeasaari.
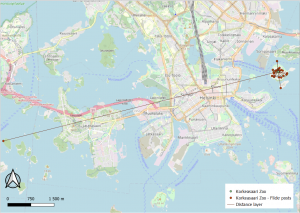
Picture 4. A map that shows the actual location of Korkeasaari zoo and Flickr posts locations where “korkeasaari” is mentioned as well as distance layers between the actual place and the locations of the posts.
There are much more Instagram posts mentioning “korkeasaari”, and the points are also scattered around in a much bigger area than Flickrs’ posts. Instagrams’ post locations are concentrated around the centre of Helsinki but many posts go as far as Espoo and even Järvenpää. I am unsure of the reason for this. Is it because the GPS of the posts is weak or are there many places around Uusimaa named “Korkeasaari”? This is the key reason why analyses based on words can be vague.
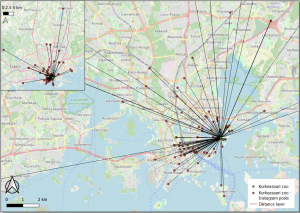
Picture 5. A map that shows the actual location of Korkeasaari zoo and Instagram posts locations where “korkeasaari” is mentioned as well as distance layers between the actual place and the locations of the posts.
Table 4. A table that shows the statistical difference of the location accuracy between Flickr and Instagram database. The min and max distance is in meters.
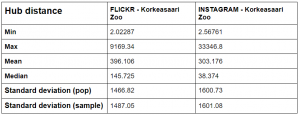
In the table above (table 4.) I have listed the statistical differences between the accuracy of the locations in the databases. When performing comparisons like these, it’s important to examine the statistical values to determine the difference between the accuracy. When inspecting the statistics, a Flickr’s post’s max distance from Korkeasaari zoo is 9169 meters while an Instagram post’s max distance from the zoo is 33 346 meters. When examining the maps (pictures 4 and 5), one can see that the furthest point from Korkeasaari Zoo in the Flickr database is in the Helsinki archipelago, which is about 9170 meters from the zoo. While the furthest point from the zoo in the Instagram database is in Järvenpää, which is about 33km from Korkeasaari zoo. The other values are quite the same between the two databases although there are considerably more points in the Instagram database. In this analysis, measurable qualities can be seen, for example, the accuracy of the location as well as the precision, while non-measurable qualities don’t appear as much in the analysis. This comparison has really opened my eyes what regards data quality. It is truly important to investigate and explore the data prior to analysis, to see if the data is suitable or not.
I have certainly learned a lot from this exercise, even though it took a long while and was difficult and frustrating at times, but most importantly, it felt meaningful doing the assignment.
