
This week’s theme, Geospatial analysis as a process, focused on how to use the graphic builder (alt. Model builder) as an automating tool in geospatial analysis. Graphic builder is a tool that helps design, perform, and automate geoprocessing tasks. A Graphic builder consists of an input, algorithm/process, and output. The input is the file or data one wants to use for the analysis, the algorithm is the geoprocessing tool that performs the analysis, and the output is the result of the analysis. Graphic builder is very helpful when dealing with large datasets with a long analysis process with many different inputs, geoprocessing tools, and outputs.
In this week’s assignment, the task was to create a buffer zone around busy traffic roads in the Helsinki region. With each road’s specific traffic amount deciding the range of the buffer zone and then extract those daycare centres that fell within the buffer zone. Each road had information in the attribute table of how much traffic travels daily on the road, and the more daily traffic, the poorer the air quality is next to the road. The daycare centres within the buffer zone are accordingly to HSY (Helsinki Region Environmental Services) too closely located to these roads, due to the high amount of pollution from the traffic.
During the whole process, I used the PPDAC framework. The framework consists of the problem or reason for the analysis, the plan, the data, the analysis, and the conclusion. I made this framework before the analysis which shows my plan of how to execute the analysis. In the framework, I listed all the inputs (data) and the geoprocessing tools (the analysis) which I used, and the desired outputs (conclusion).
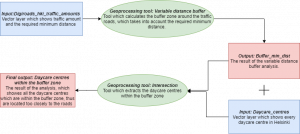
Picture 1. The pictures show my PPDAC framework which lists all the inputs, tools, and outputs for the exercise
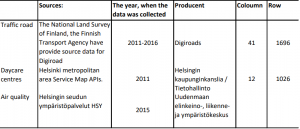
To be able to do this analysis, I used data from many different sources. All my sources have been collected by Finnish municipalities or governmental agencies, so the data is very legitimate. This makes the result of the analysis reliable.
Table 1. In the table, there are listed all the sources I used for the assignment, when the data was collected and who is the producer as well as the number of columns and rows in the attribute table that each dataset had.
I used the variable distance buffer tool to create a variable buffer zone with each road’s specific traffic amount deciding the range of the buffer zone. When the buffer zone was made around the roads, I used the intersection tool to see which daycare centres fell within the buffer zone. At the beginning of the task, I suffered from some technical issues, the variable distance buffer tool couldn’t find my chosen input vector layer. I asked the instructor for help and she helped me to locate the problem, then the graphic builder ran successfully, and an output emerged. Afterward, the analysis went on without a problem. Because of the frustration at the beginning of the assignment with the technical issues, I’ll grade this exercise a 3 on the difficulty scale. The idea of the assignment and what geoprocessing tools to use weren’t hard to figure out, but the technical aspects of the program and the graphic builder were somewhat more challenging. Below is my graphical builder chain when the analysis was completed.
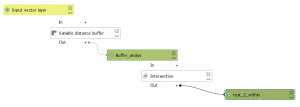
Picture 2. This is how my graphic builder chain looked like at the end of the analysis.
The outcome of the analysis showed that only 21 out of 1026 daycare centres fell within the buffer zone. Meaning that these daycare centres are located closer than the allowable distance to a given traffic road because of the poor air quality, according to the HSY rapport Air Quality – Minimum and recommended distances for housing and sensitive locations. So, the remaining 1005 daycare centres were located at least the minimum distance from a given road and not affected by traffic pollution and poor air quality to the same extent as those inside the buffer zone.
Almost all of the 21 daycare centres within the buffer zones are located in the centre of Helsinki, next to important and busy highways and less busy traffic hubs. Within the centre of Helsinki itself, most of the daycare units affected by poor air quality, due to traffic emissions are located within the districts of Kallio, Sörkkä, and Töölö. Mechelininkatu, Helsinginkatu, Länsiväylä, Mannerheimintie, and Mäkelänkatu are the most important roads that affect the daycare unit’s air quality the most.
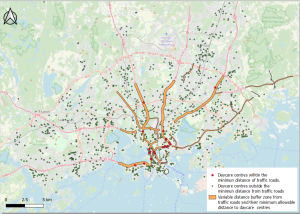
Picture 2. A map of the Helsinki region shows daycare units within the buffer zone as well as daycare units that are outside the buffer zone and the buffer zone itself.
In the optional assignment, the task was to create a new field in the attribute table with the values of the recommended distances from traffic roads. I used the field calculator to calculate the recommended distance. This resulted in a new field, with the recommended distance. Afterward, I made a variable distance buffer analysis in the graphic builder with the new field
as the distance field. I also used the intersection tool to extract daycare units, which were within the minimum distance as well as within the recommended distance, so-called the “grey zone”.
The red squares in the map below portray the daycare centres which are within the risk zone, and the green squares portray those daycare centres which are between the minimum distance and the recommended distance, which I call the “grey zone”. The smaller white dots show daycare centres that are well outside the recommended distance, and thus not affected by the pollution from the traffic emissions. The red buffer zones show the minimum distance, whilst the yellow buffer zones show the recommended distance from traffic roads.
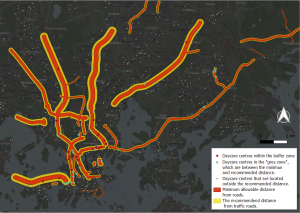
Picture 3. The map shows daycare centres within, between and beyond the minimum, and recommended distances from traffic roads as well as the minimum and recommended buffer zones.
During these exercises, I learned how to use the graphic builder in Quantum GIS as well as add a new field to the attribute table. I haven’t used QGIS for about a year now, so the exercises did also refresh my memory and skills in QGIS.