How long does it take to park a private car in Helsinki Capital Region? – A map based survey

The parking survey is available in English and in Finnish.

Read in Finnish

How long does it take to park a private car in Helsinki Capital Region? Is there variation in parking times in different districts of the Capital Region? How can we explain the hypothetical variation?

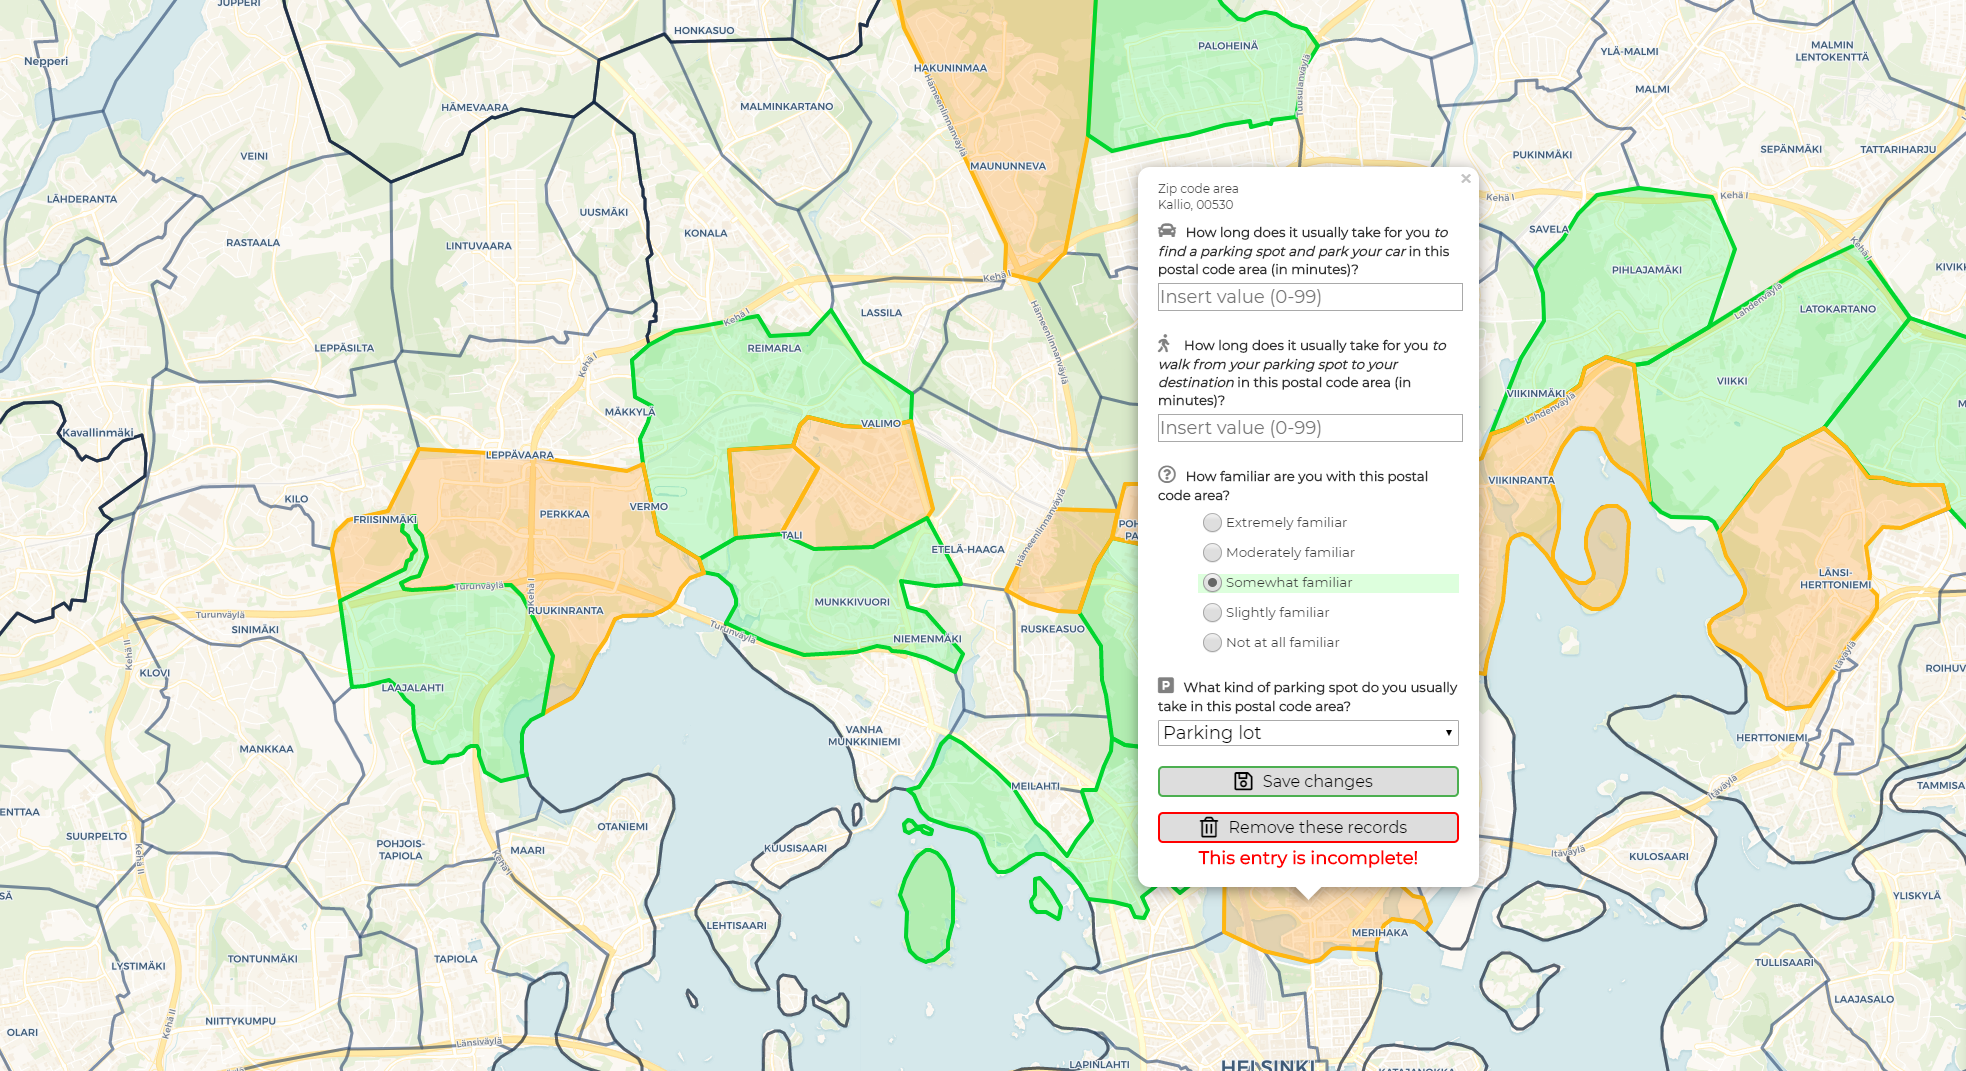
We are now researching how long does it take for a private car to find a parking spot, park and walk to one’s final destination in different areas of Helsinki Capital Region using a map based survey. In the survey linked below the user chooses postal code areas where they remember having parked in the last two years. For each postal code area user is asked to fill a short form how their parking experience usually is in that area. The survey is created in such a way that data can be sent from as many postal code areas as the user wants – all in one session.

Please find the map based web application survey here. We ask you to answer to the survey latest at 30th June 2019. The survey starts up by default in English. If you wish to fill out the survey in Finnish, you can change the language by clicking the EN/FI button located in the upper left corner of the screen.

About the research

This survey research is a part of the Master’s thesis of Sampo Vesanen. The work is connected to the Helsinki Region Travel Time Matrix, a tool created by Digital Geography Lab which represents travel time distances between statistical grid cells in Helsinki Region by public transport, walking and bicycling. The values in the travel time matrix are calculated using the door-to-door approach. For private cars this means that searching for parking, the parking proper and walking to one’s destination is a part of the travel time. Up until now the time it takes to carry out this process has been a singular estimation deployed to the entire Helsinki Capital Region. This does not represent reality well enough.

The data collected from this survey are used to answer the following questions: what is the variation in parking times between postal code areas in Helsinki Capital Region, what could cause the variation and what is the significance of the parking time in the context of the total travel time of a private car in Helsinki Capital Region. The finalised results of the Master’s thesis will be used to supplement the private car parking process data in the Helsinki Region Travel Time Matrix.

Filling the survey

In the survey the user is asked to estimate how their parking experience usually is in each postal code area. Please answer to each question using your best judgement and answer to each postal code area only once. We seek responses not older than two years because the urban structure of Helsinki Capital Region experiences constant change and possibilities for private car parking change with it. If you require additional information about the questions in the survey, please refer to the information dialog window in the survey. This window will appear on the screen of your device at survey start-up.

You can use a desktop computer, a laptop or a mobile device to fill out the survey. It requires 1-10 minutes of your time. On desktop or laptop it is important you use the latest browser software, recommendations being Chrome or Firefox. On mobile devices it is recommended to use a device that runs Android with Chrome being the browser software. If you wish to fill out the survey using your mobile device (especially if using an Apple device), please read the mobile usage instructions in the information dialog window.

Usage of gathered data

The data gathered in this survey do not reveal any personal information about respondents because of the general scope of the questions used. The web application running the survey will save your IP address for tracking user activity. In the analysis phase of the thesis all collected IP addresses will be altered into random and anonymous string of characters and all the IP addresses will be deleted. The survey web application uses cookies to save user preferences. If you do not delete the cookies manually, they will expire 90 days from their creation.

Further information

In any inquiries regarding the survey or the research, please contact Sampo by email: sampo.vesanen(at)helsinki.fi.

Diversity in digital urban spaces of Helsinki

Digital urban spaces of Helsinki seen from Instagram data have high language diversity, the topics of Finnish and English posts differ spatiotemporally and content-wise to some extent and more is discovered in my Master’s thesis. Finnish and English language posts dominate different areas of Helsinki and topics of Finnish posts have connections to everyday life while English topics are influenced by tourists

With ubiquitous internet access and increasing amounts of social media users and content, an ever larger part of social interactions and common discussions are being augmented with digital means of communication. This renders social media data valuable for scientific inquiry in order to understand contemporary societies, cultures, and phenomena. Social media data is being produced constantly in vast quantities and is mostly produced by users living in urban areas. The data produced in social media can have a reference to a real-world location e.g. in the form of a geotag or geographic coordinates enabling spatiotemporal analysis. In order for scientific knowledge to keep up with the quick changes in society and cultures enabled by the internet and social media, social media data sets need to be investigated and doing this requires powerful novel and interdisciplinary methods.

In my thesis, I delved into the digital urban space of Helsinki by applying topic modeling to Finnish and English Instagram posts’ captions from Helsinki. By looking at the topics of Instagram posts made in both English and Finnish languages, my aim was to discover how language affects Instagram topics, the spatiotemporal distributions of these topics and whether linguistic technologies are applicable in geographic research. In order to do all of this, a number of preprocessing steps were required. The language of the posts had to be identified in order to separate Finnish and English posts from another. After this, the caption texts were lemmatized to make LDA topic modeling viable. Lemmatization is a natural language processing technique with which inflected words are returned to their basic ‘dictionary’ form. For topic modeling of morphologically rich languages, such as Finnish, this is a critically important step without which LDA topic modeling would not yield sensible results, but it is recommended for English as well. Then the lemmatized captions were vectorized and fed into an LDA topic model which modeled language-specific topics for the Helsinki area and a few city districts.

Instagram posting activity in Helsinki follows a three-peak rhythmicity.

Instagram posting activity in Helsinki follows three-peak rhythmicity.

Plotting the hourly Instagram posting activity by each weekday reveals that Instagram posting frequency in Helsinki follows a three-peak rhythmic structure: peaking at common meal times each day of the week. The temporal structure also shows that Saturdays and Sundays are the most popular days to post on Instagram in Helsinki. These findings hint at a connection between Instagram posting in Helsinki and leisure time activities quite strongly, suggesting Instagram data might be suitable to find out where Instagram users are and what they’re doing on their own time.

The linguistic landscape of Helsinki from Instagram posts.

To decipher which topics are popular in Finnish and English Instagram posts, the language of the posts was identified revealing the diverse linguistic landscape of Instagram posts in Helsinki. By only focusing on Finnish and English, a lot of knowledge is lost in my analysis, underscoring the importance of a multilingual approach in future work. The geolinguistic division between Finnish and English Instagram posts in Helsinki shows a few key patterns. Firstly, the city center is the area of highest posting intensity, but smaller posting hubs appear along with major transport nodes in Helsinki. Secondly and perhaps more interestingly, central Helsinki is quite clearly divided in two between the languages. Finnish is more popular in areas north of Hakaniemi, while English comes out on top in the southern parts of the center. The main dividing line seems to be Töölönlahti and the small channel connecting Töölönlahti to the Baltic sea, which has historically been the dividing line between the working class in the north and the bourgeoisie in the south. The biggest relative differences between the languages are in peripheral areas with very low post counts suggesting that popular areas for posting are popular for both languages.

Two most common languages of Instagram posts in Helsinki divide the city.

Finnish and English Instagram posts’ topics differ both spatially and temporally at different scales, even though Instagram data was shown to be similar in content and temporal rhythm between the languages. Posts in both languages mostly deal with leisure-related topics, but Finnish topics have several references to everyday life, while English topics do not. Also, Finnish posts didn’t have one numerically dominant topic while as English posts did: ‘morning’. The spatial structure of the topics reflects the complexity of social media content, generality of the topics and the fact that posting location might not specifically relate to the topic of the post. Also, Instagram’s geotagging is based on points-of-interest which introduces slight to moderate spatial inaccuracy into the data as the exact posting coordinates are not recorded. There is, however, some spatial logic to the topics, for instance, the prevalent topic of Suomenlinna island is ‘summer’ for Finnish posts and ‘New Year’ for English posts, topics around the Olympic stadium revolve around sports. Statistically validating the connection between the topic and the underlying geographic region is highly problematic if the topic is very general.

Topics of Finnish Instagram posts in Helsinki aggregated into a 250-meter grid.

The topics become more specific at city district level which is to be expected with the limited spatial extent of a city district. However, at the city district level, the POI-based location structure becomes more problematic due to the aggregation of posts under POIs. At the city district scale, English topics have clearer references to touristic sights in the city districts suggesting a presence of tourists or at least sightseeing as an activity in the data set. Finnish topics, however, maintain a connection to everyday life with topics like “work”, “family” and “everyday life” and touristic sights are not mentioned.

There are a few things to consider when doing research with social media data. First, social media posts are often about subjects the user considers positive creating a positivity bias into the data. Second, results from social media analyses only represent the users of its particular social media platform and finding out to what extent this group represents the population as a whole is difficult. Third, the locational accuracy of posts isn’t in all cases very good, because geo-tagging functionality can be based on fixed points-of-interest and not to the actual coordinates of the user at the time of posting. This means that large amounts of posts can be and are aggregated on to commonly named points-of-interest. For instance, “Helsinki, Finland” was one of the most popular location names in the data and surprisingly consisted of numerous different points across Helsinki. Fourth, social media posts are multilingual and most of the tools for content analysis have been developed for English and most of social media research deal with English content. Including minor languages into the analysis would ensure a broader and less biased understanding of what is going on in social media. Fifth, social media companies are constantly developing and changing their APIs making access to data and reproducibility depend on the whims of social media corporations. Regardless of these error elements and limitations, social media data can be a very fruitful data set for scientific analyses of the city and (some of) its people.

Tuomas Väisänen

Here’s the link to my Master’s Thesis (only in Finnish)