Towards summer cottages: Mobility flows amid the COVID-19 outbreak in Finland in March

Olle Järv, Elias Willberg, Tuomas Väisänen, Tuuli Toivonen

According to Statistics Finland (2018), there are more than half a million summer cottages around Finland. They are mostly located in rural areas close to waterbodies – lakes and seaside. In a country with 2.7 million households, such a high number of cottages may change the population patterns drastically once people would move to their cottages in large numbers. This is a potential risk during the epidemic outbreak such as the COVID-19 – health care services are designed mostly based on the permanent population and the cottage dwellers might break the balance in sparsely populated areas. Our preliminary findings already indicated that despite travelling restrictions due to the COVID-19 outbreak in Finland many people escaped from big cities to their summer cottage, see here. But was it really the lure of the summer cottages that explain the mobility patterns to more rural countryside?

Method: We used anonymised and aggregated mobile network data from Telia Crowd Insights such as activity location data as in our previous analyses, and further examined trip data between municipalities. Activity location data indicates the presence of people in a municipality – once a person stays at least 20 minutes in one municipality during one day, then his/her presence is counted as one activity location in given municipality. For example, when having a longer lunch break in a gas station during a long-distance travel. Thus, a person can have several activity locations in different municipalities each day. Trip data is calculated between the two consecutive activity locations at municipality level. In trip data, actual long-distance travel is counted as two different trips, if a longer break is taken during travelling. For example, travel from Helsinki to Rovaniemi by train via Jyväskylä is counted as two trips in data, because train stops at Jyväskylä longer than 20 minutes. These nuanced must be taken into account while reasoning findings.

Continue reading “Towards summer cottages: Mobility flows amid the COVID-19 outbreak in Finland in March”

Kesämökkejä kohti – Liikkumisvirrat Suomessa COVID-19 epidemian aikaan

Olle Järv, Elias Willberg, Tuomas Väisänen, Tuuli Toivonen

Tilastokeskuksen mukaan (2018) Suomessa on yli puoli miljoonaa kesämökkiä. Pääosin ne sijaitsevat harvemmin asutuilla alueilla lähellä vesistöjä. Maassa, jossa on yhteensä 2.7 miljoonaa kotitauloutta, kesämökkien määrä voi vaikuttaa merkittävästi väestön sijoittumiseen, etenkin jos ihmiset siirtyvät kesämökeilleen massoina, kuten tapahtui COVID-19 kriisin alettua. Kun terveyspalvelut ovat pääosin suunniteltu vakituisen väestön pohjalta, kesämökkeilijät voivat merkittävästi lisätä terveyspalveluihin kohdistuvaa taakkaa. Alustavat tuloksemme viittasivat siihen, että moni siirtyi kesämökilleen isoista kaupungeista COVID-19 epidemian seurauksena huolimatta hallituksen matkustusrajoituksista (linkkI). Mutta selittikö kesämökkien houkutus todella löytämämme liikkumisrakenteet?

Menetelmä: Kuten aiemminkin, käytimme Telian Crowd Insights-palvelun anonymisoitua ja yleistettyä mobiiliverkkodataa, kuten aktiviteettisijainteja ja matka-aineistoa. Tilastotasoisista aineistoista ei ole mahdollista tunnistaa yksittäisien ihmisten tai pienten ryhmien liikkeitä. Aktiviteettiaineisto kuvaa väestön oleilua  kunnan alueella, jossa jokainen 20 minuutin oleilu yhden päivän aikana tallennetaan aktiviteetiksi kyseisen kunnan tilastoon. Tällöin esimerkiksi pidempi kahvitauko huoltoasemalla lasketaan aktiivisuussijainniksi ja niitä voi olla useampia päivän aikana eri kuntien alueella. Matka-aineisto puolestaan lasketaan kuntatasolla kahden akvitiviteettisijainnin väliksi. Tällöin matka-aineistossa pitkät matkat voivat tulla lasketuksi kahdeksi tai useammaksi matkaksi riippuen pitkien taukojen määrästä. Esimerkiksi junamatka Helsingistä-Rovaniemellä lasketaan useaksi matkaksi mikäli juna pysähtyy osalla asemista, kuten Tampereella, yli 20 minuutiksi. Nämä tekijät tulee ottaa huomioon tuloksia tulkitessa.

Continue reading “Kesämökkejä kohti – Liikkumisvirrat Suomessa COVID-19 epidemian aikaan”

COVID-19 changed the distribution of people in Finland in March – snapshots from aggregated and anonymized mobile network data

Olle Järv, Elias Willberg, Tuomas Väisänen, Tuuli Toivonen

Finland, like all other countries in Europe, was hit by the emergence of the covid-19 in March 2020. On Thursday 12th of March, the government gave the first serious recommendations of cancelling big public gatherings and encouraging distant working.  On Monday 16th March the government presented a state of emergency. The schools and public services like museums and libraries were closed and visits to elderly care homes were prohibited. Travel was to be limited to minimum. Historically, the border between Sweden and Finland was closed on the 19th March, restricting the workforce to move across the border in the northern areas and Åland islands. As the glittering snow of Lapland was still attracting tourists from the south, the ski resorts were closed on the 23rd March. As the strongest and an unprecedented measure, the border of the Helsinki-Uusimaa region was closed for personal traffic on the 28th March.  

We at Digital Geography Lab received data from mobile phone operator Telia to analyse how these recommendations and restrictions were followed. Below are some first views on the results, showing how the presence of people changed in the 310 municipalities of Finland during February – March 2020. We concentrate on March and compare the presence of people in different municipalities to the first week of February (1.-7.2.2020) – a baseline week before the start of the school winter holidays and the emergence of Covid 19.  The analysis is based on anonymised and aggregated mobile network data (Telia Crowd Insights activity data). A single activity is recorded of every 20 minute stay in one location. Some February days (12.2., 13.2, 25.2.) are missing in the dataset.

Continue reading “COVID-19 changed the distribution of people in Finland in March – snapshots from aggregated and anonymized mobile network data”

Missä ja milloin COVID-19 mullisti liikkumisen? Analyysiä anonymisoidusta ja aggregoidusta mobiiliverkkodatasta

Olle Järv, Elias Willberg, Tuomas, Väisänen, Tuuli Toivonen

Koronavirus mullisti elämämme maaliskuussa 2020. Vapaa liikkuminen loppui ja ihmiset linnoittautuivat koteihinsa mahdollisuuksien mukaan. Torstaina 12.3. hallitus antoi ensimmäiset konkreettiset suositukset liikkumiseen liittyen: etätöitä suositaan ja isot tapahtumat perutaan. Jo seuraavan viikon alussa julistettiin poikkeustila, jonka turvin suljettiin koulut, kirjastot, museot ja vierailut vanhainkoteihin keskeytettiin. Matkailu kehotettiin rajaamaan minimiin yleisesti ja rajantarkistukset otettiin käyttöön kaikilla Suomen rajoilla, myös Ruotsin suuntaan. Tämä rajoitti myös monien työmatkoja Tornionjokilaaksossa ja Ahvenanmaalla.  Pohjoisen hohtavat hanget houkuttelivat vielä väkeä, joten hiihtokeskusten sulkemisesta pikavauhdilla ilmoitettiin 22.3. Merkittävimpänä toimena vapaan liikkumisen Suomessa nähtiin Uudenmaan maakunnan rajan sulkeminen. Tieto sulusta annettiin maaliskuun viimeisellä viikolla ja varsinainen sulku astui voimaan keskiyöllä 28.3. Mitä liikkumiselle oikeastaan tapahtui näiden viikkojen aikana? Jäivätkö suomalaiset kotiin ja missä niin tapahtui ja koska?

Digital Geography Lab tutkimusryhmämme sai käyttöönsä matkapuhelinoperaattori Telian anonymisoitua ja yleistettyä mobiiliverkkodataan perustuvaa kuntatasoista tilastotietoa helmi-maaliskuulta 2020. Data on poiminta Telian Crowd Insights datapalvelusta, ja se kuvaa väkijoukkojen oleskelua tietyssä kunnassa aina yhden päivän aikana vähintään 20 minuuttia kerrallaan. Alla näet joitakin nostoja vertailuistamme eri alueiden ja ajanjaksojen välillä. Vertailuajankohtana käytämme helmikuun ensimmäistä viikkoa, jolloin korona oli vasta kaukomaiden uutinen eivätkä koulujen lomat vielä vaikuttaneet ihmisten liikkumiseen.

Continue reading “Missä ja milloin COVID-19 mullisti liikkumisen? Analyysiä anonymisoidusta ja aggregoidusta mobiiliverkkodatasta”

A new paper about identifying large ecological networks for regional planning with Zonation

A new paper out! Study “Identification of ecological networks for land-use planning with spatial conservation prioritization” by Joel Jalkanen, Tuuli Toivonen, and Atte Moilanen has just published a study in the Landscape Ecology journal. In the paper, we describe the work where we identified large well-connected ecological networks and ecological corridors for the Regional Council of Uusimaa, an authority responsible for regional planning in the Uusimaa province in Southern Finland. We used the Zonation spatial prioritization software in a novel way for identifying large well-connected structures, and the rarely-used corridor retention tool in Zonation for identifying ecological corridors. Zonation has been previously used to support regional zoning in Uusimaa, and dozens on layers of biodiversity data was available in the area.

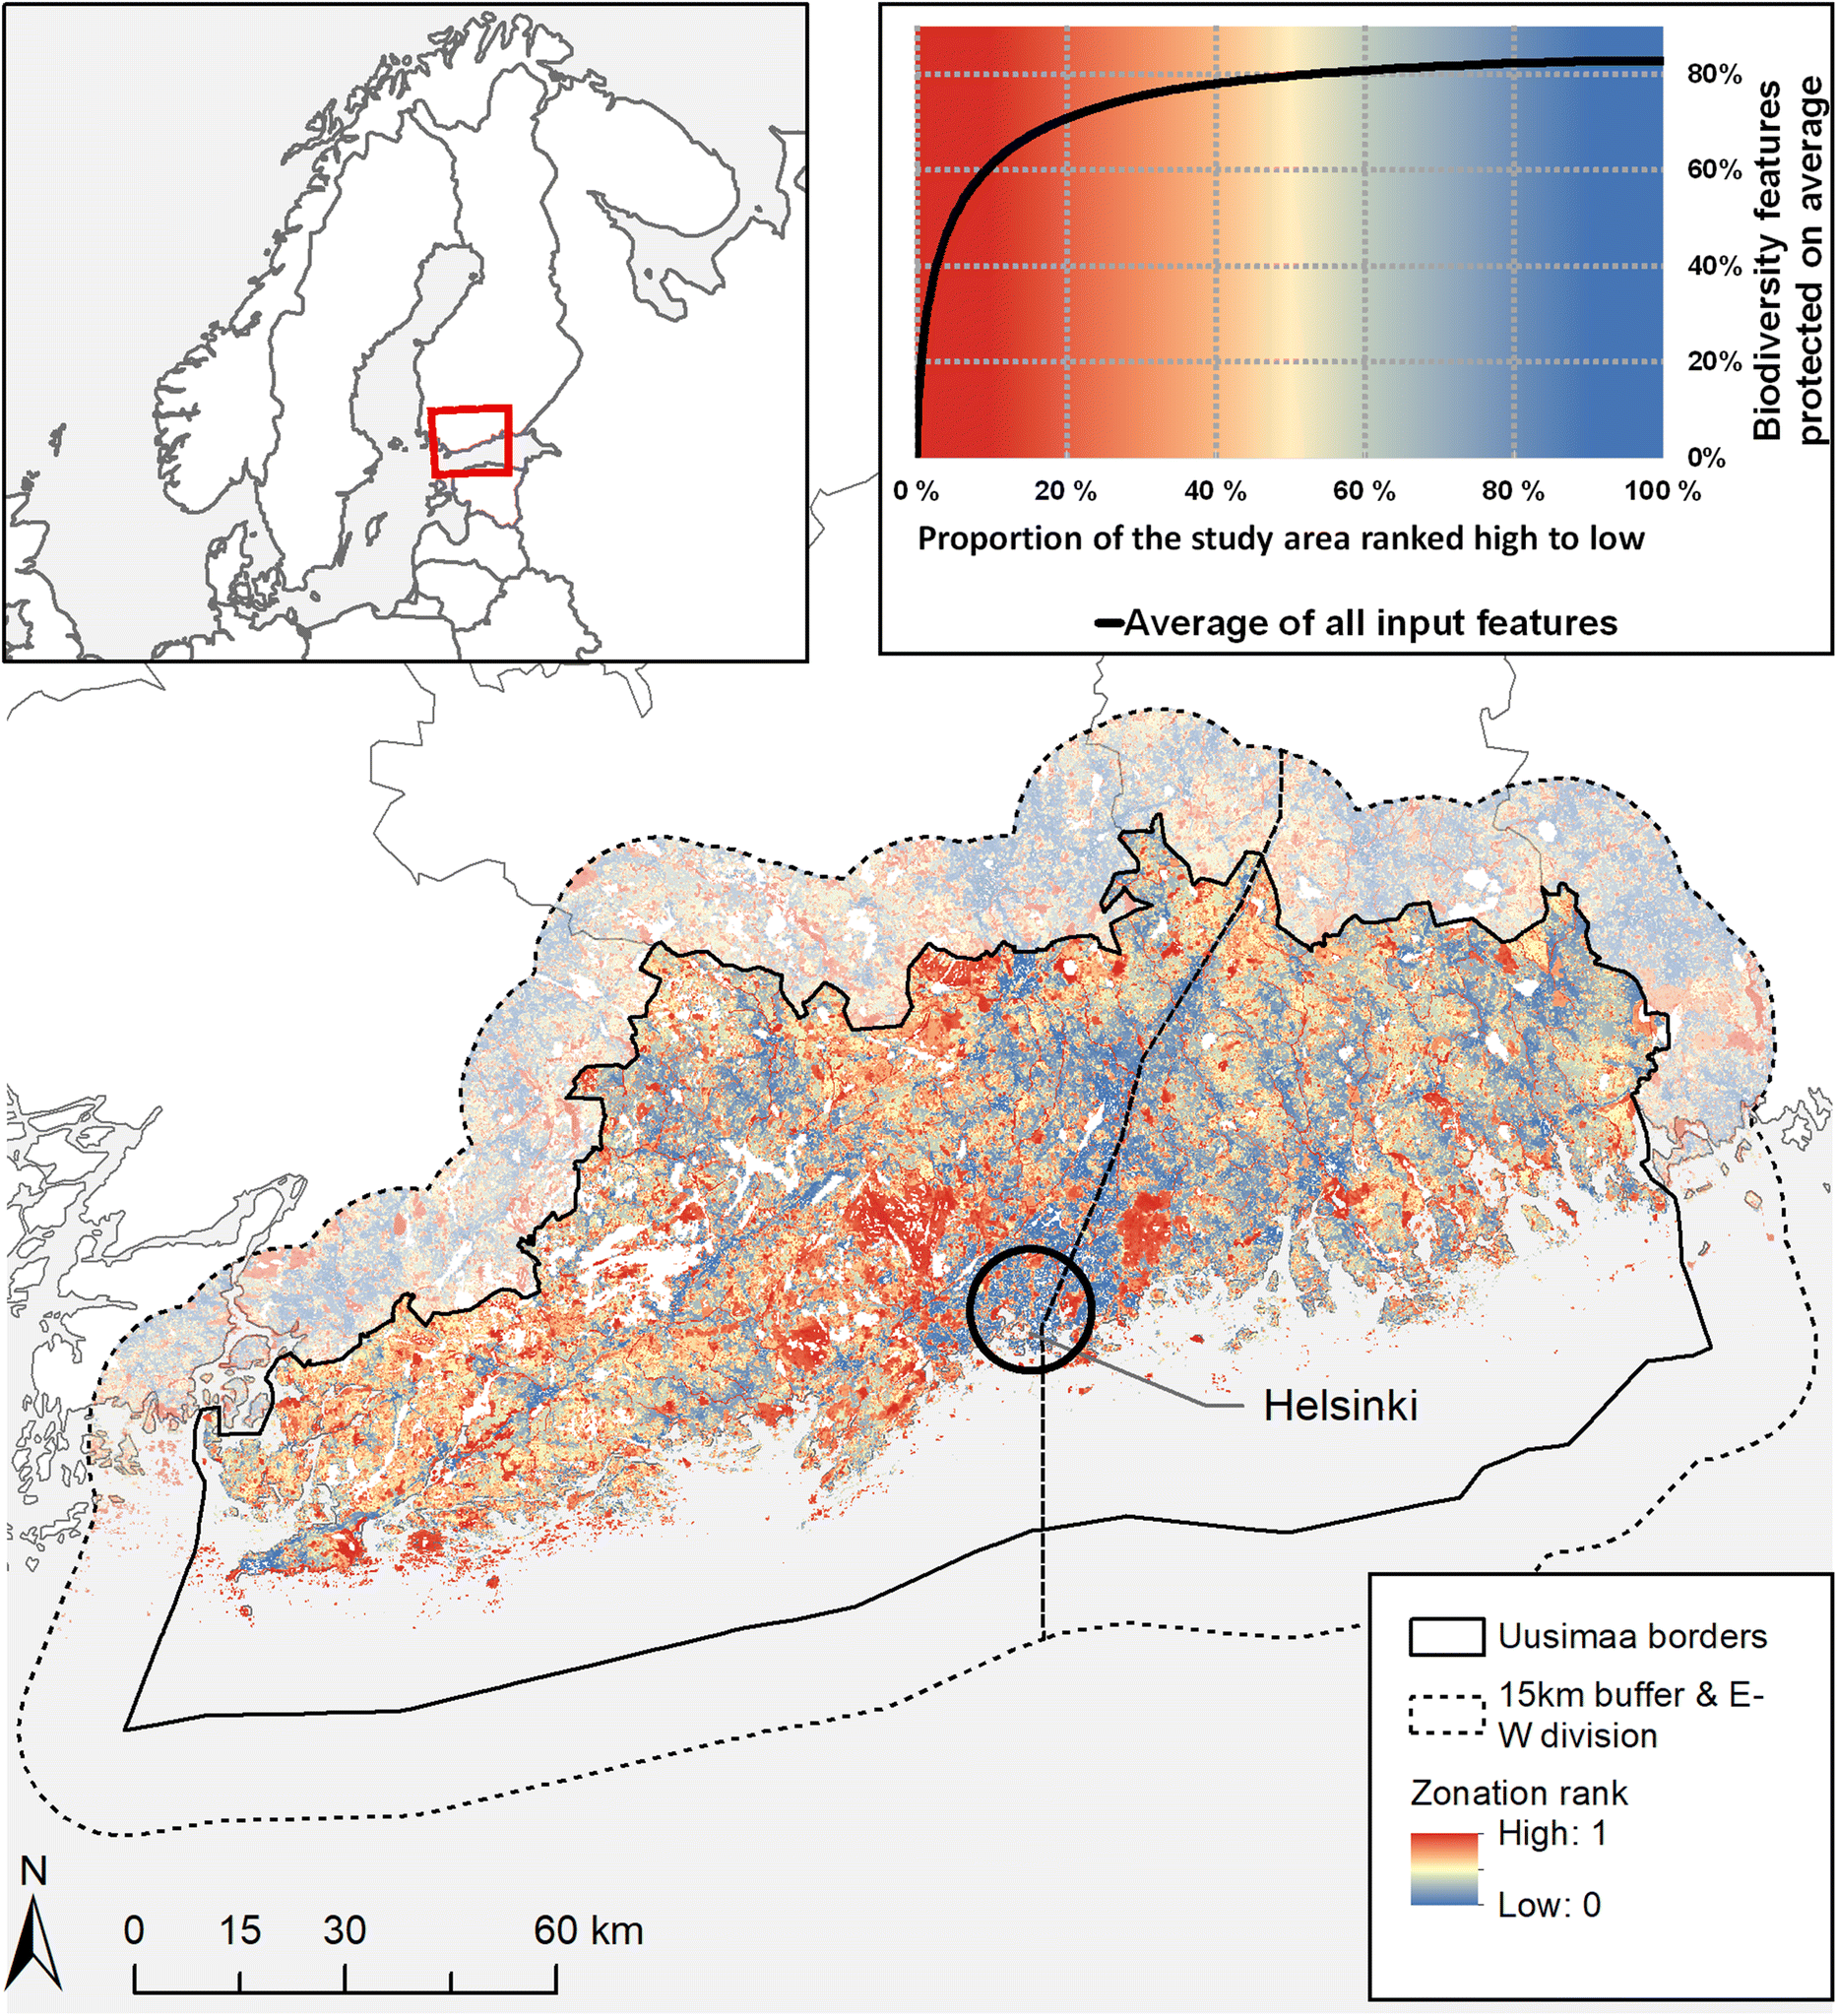
It is quite straightforward to identify local high-priority areas (such as areas of high habitat quality) from Zonation results. In the case of Uusimaa, biodiversity is greatly scattered and concentrated in the top-20% priority areas. Ensuring the regional-level connectivity would be, indeed, highly important.

https://media.springernature.com/original/springer-static/image/art%3A10.1007%2Fs10980-019-00950-4/MediaObjects/10980_2019_950_Fig1_HTML.png

Uusimaa has a strong human influence, and high-priority areas are scattered. Picture from the article.

Continue reading “A new paper about identifying large ecological networks for regional planning with Zonation”

Mobility research in areas with seasonal population changes

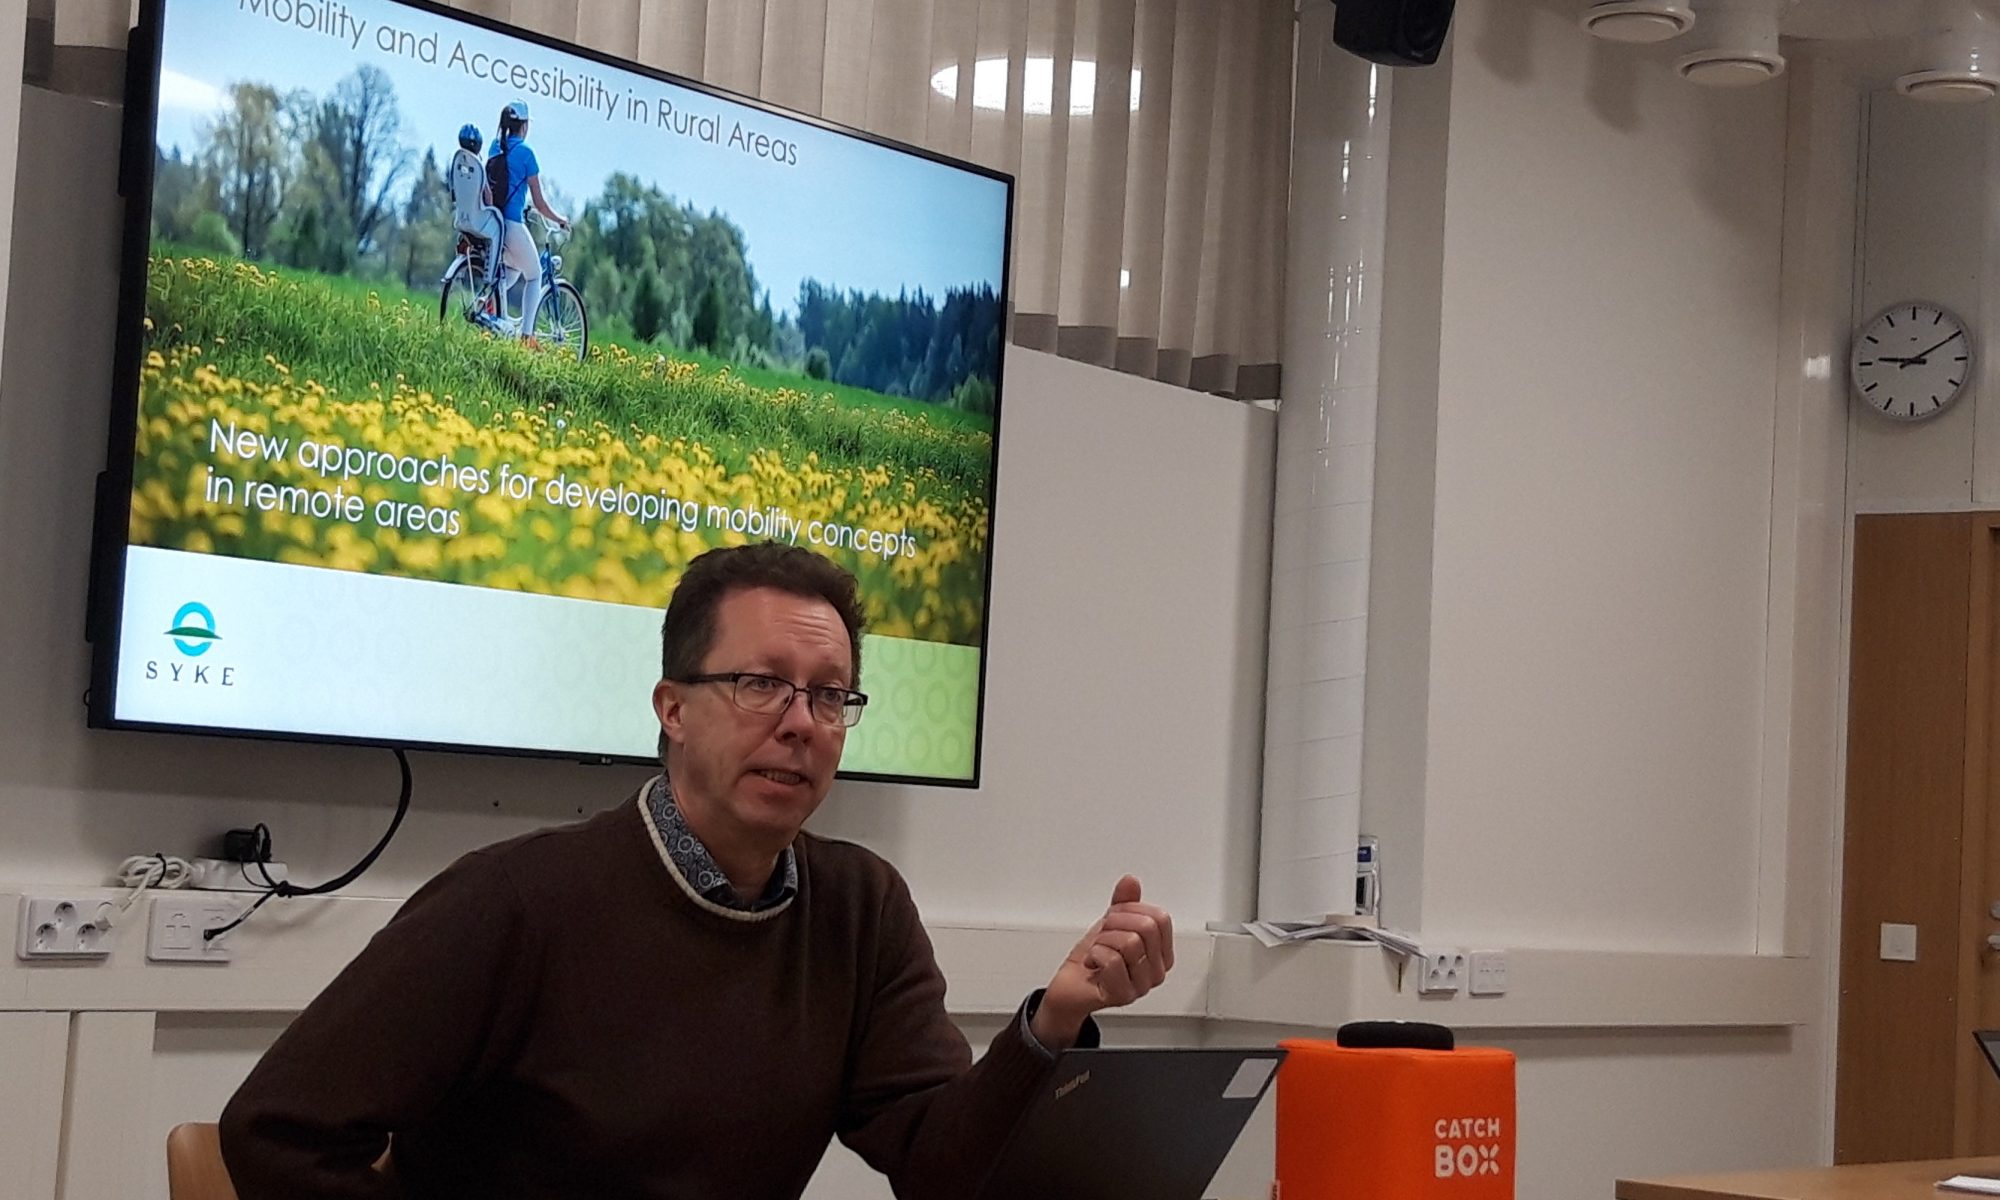
In the end of 2019, SYKE, the Finnish Environmental Institute, arranged a miniseminar on mobility research in urban, rural and touristic settings. The seminar addressed mobility research interrelations with spatial planning and governance, stakeholder engagement in spatial and transportation planning, sustainable mobility challenges in remote and touristic settings, and various methods for acquiring, processing and analysing mobility data.

The seminar was held in Helsinki and was part of the InterReg Baltic Sea-funded project MARA. The overall aim of the project is to address mobility and accessibility challenges in rural areas. Project activities and the perspectives and challenges of various mobility data were presented in the seminar by Kari Oinonen (SYKE), Age Poom (Digital Geography Lab, University of Helsinki & Mobility Lab, University of Tartu), Daniel Brandt and Tobias Heldt (both from CeTLeR, Dalarna University). SYKE researchers introduced their studies on GIS use in urban and rural planning (Ville Helminen), rural mobility, accessibility and travel related to second homes (Antti Rehunen), public participatory GIS (Elina Nyberg) and the architecture of spatial data infrastructure in SYKE (Kaisu Harju).

Continue reading “Mobility research in areas with seasonal population changes”

Can we use Twitter data to estimate population distribution in Finland?

One of the main data processing steps before making use of novel data sources (e.g. Twitter data) for better understanding social processes and phenomena is the detection of users’ origins – be it at country, municipality or neighborhood level. This allows us to know whose Tweets in some geographical area (say, in a certain city or a neighborhood) we investigate. The most basic way is to distinguish locals from non-locals when examining mobility and activity locations of people. A more advanced analysis would require knowledge about origin countries in tourism studies and origin neighborhoods in segregation studies, for example.

This data processing step is also a prerequisite for cross-border mobility research – we need to know origins of people in order to categorize and analyze movements across country borders extracted from geotagged Tweets. Hence, it is the priority for our cross-border project. See, for example, the recent recent cross-border mobility analysis in the case of the Greater Region of Luxembourg from the MSc thesis by Samuli Massinen.

Continue reading “Can we use Twitter data to estimate population distribution in Finland?”

Done with the teaching! Overview of autumn 2019 courses

Autumn term is coming to an end!

Course teaching at the University of Helsinki is ending this week for the winter break. This autumn, researchers at the Digital Geography Lab have been working hard to share their knowledge and train the next generation. Innovative teaching approaches and teaching materials have also been developed further for the use of the University of Helsinki Geography programmes.

We congratulate and thank Vuokko Heikinheimo for leading and updating the hugely successful Automating GIS processes course together with Henrikki Tenkanen, Olle Järv for running and improving the Quantitative research techniques and analysis in human geography course, and Joel Jalkanen for putting lots of effort to re-inventing the Conservation Planning and Zonation course, together with Enrico Di Minin.

Continue reading “Done with the teaching! Overview of autumn 2019 courses”

Congratulations Claudia, Hertta and Elias for the City of Helsinki Master’s thesis award!

Yearly award for the best Master’s thesis have been again presented by the city of Helsinki on Monday the 9th of December 2019. We at the Digital Geography Lab would like to give special congrats to three awarded GIS wizards from the Department of Geography and Geosciences, Univerisity of Helsinki: Claudia Bergroth, Hertta Sydänlammi and Elias Willberg!

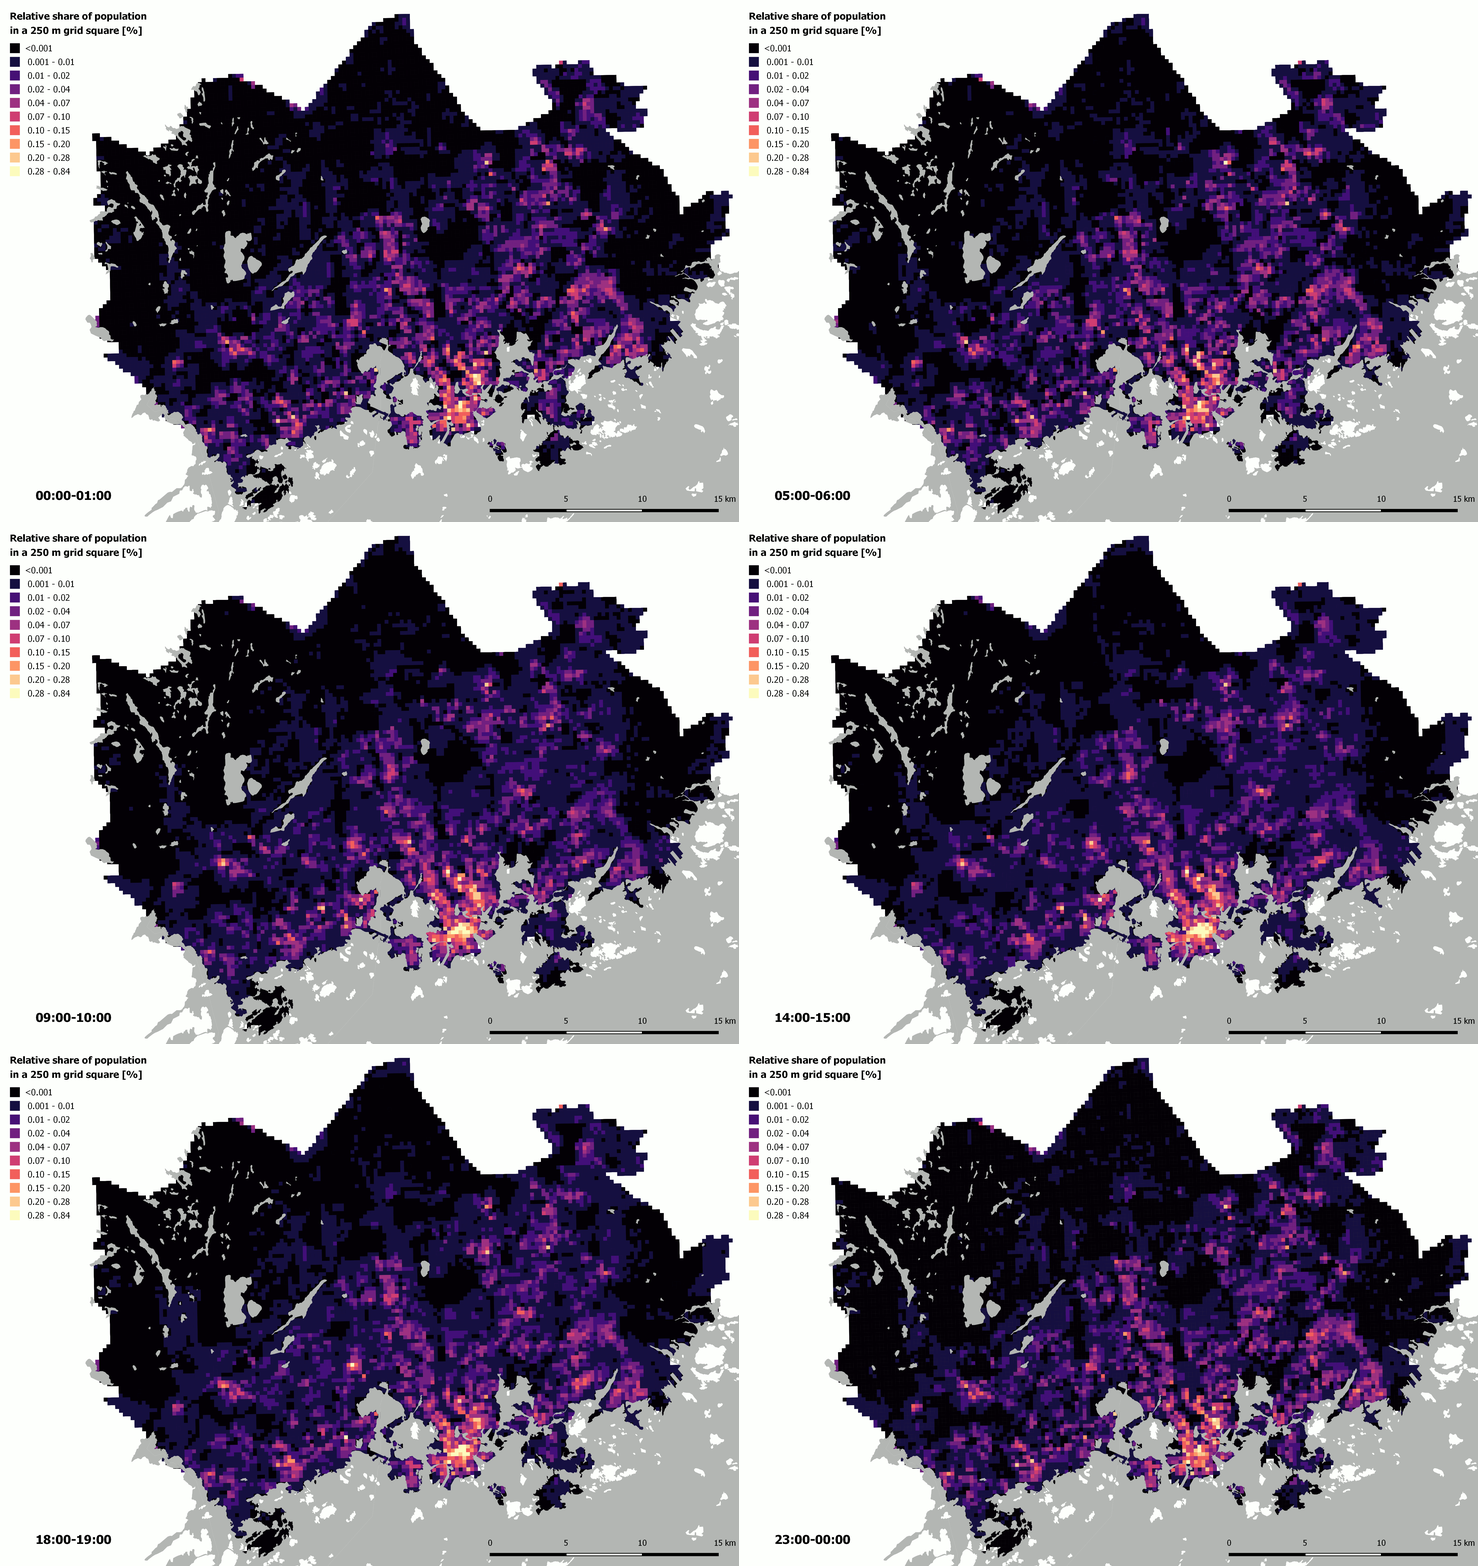
Bergroth Claudia (2019): Uncovering population dynamics using mobile phone data: the case of Helsinki Metropolitan Area.

The estimated hourly distribution of people on an average weekday in the Finnish Capital Region based on network-driven cellular mobile phone data. Read more about Claudia’s work in this blog post. 

Continue reading “Congratulations Claudia, Hertta and Elias for the City of Helsinki Master’s thesis award!”

Mapping the linguistic landscape of the Helsinki metropolitan area

The discipline of linguistics has a long-standing interest in researching language use in cities, because they bring together speakers of different languages from different backgrounds. Examples range from William Labov’s classic empirical research on the relation of social class and pronunciation of American English in New York City to modern theories of multilingualism in cities by Alastair Pennycook and Emi Otsuji. Regardless of the scope or focus, the consensus is that interactions between different languages and their speakers drive linguistic variation and change, whose effect is particularly strong in densely populated cities.

Within sociolinguistics, a subfield of linguistics broadly concerned with language in society, one emerging approach to the study of languages in cities concerns linguistic landscapes. The study of linguistic landscapes mainly focuses on the visibility and presence of languages in the built environment, performing qualitative analyses of languages in signs, advertisements, billboards and other media in built environments.

However, the physical spaces in which languages exist are being rapidly transformed due to technological development. These spaces increasingly extend into the digital realm due to the widespread use of positioning technology in smartphones and other mobile devices, which allow users to create and associate content with physical locations via geotagging. Social media platforms with geotagged content are a hallmark example of this development, which also offer new opportunities for linguistic research.

Continue reading “Mapping the linguistic landscape of the Helsinki metropolitan area”