
When considering dwellers in cities and sub-urbans, healthy lifestyles are noticed to be important factors to prevent exlusion. Therefore, opportunity to live with active life styles is an important thing to consider in cities and sub-urbans. It has been shown earlier that the proximity to sport facilties and other physical activity (PA) environments increase the amount of physical activity . MSc Ekku Keurulainen (Master’s Programme in Urban Studies and Planning, University of Helsinki) studied in his thesis titled ”Spatial accessibility of swimming facilities in the Greater Helsinki region: a comparison about socioeconomic differences and segregation” how communally organized built sport facilities are spatially accessible in the region – speficially swimming halls. Swimming halls are general, communally provided, non-profit, and easy-to-access sport facilties. In addition, swimming halls are important, suitable, and useful for a broad variety of dwellers – elderly people, children, families, disabled people etc. Water sports are suitable for many people and in the swimming hall one can do various kind of sports on same place.
Authors of this blog post: Petteri Muukkonen & Ekku Keurulainen, University of Helsinki
In his thesis, Keurulainen calculated for his study area the Greater Helsinki Region (~ Helsinki Capital region) a disadvantage sum index based on three variables in the population statistics: unemployment rate, proportion of low-income households, and finally proportion of people with no university level degree of the labour forceanalyzed spatial accessibility. The index value of 100 units represents an area average. This sum index was then compared with travel time calculations for different transportation mode (~spatial accessibility). For each 250 m x 250 m grid cell in the population data set a minimum travel time to the closests swimming hall was calculated. Then the most and least disadvantaged quintiles in the population data grid were compared by the Student’s t-test. The aim was to compare if the most and least disadvantaged living areas have inequal spatial opportunities to access (i.e. travel times by walking, cycling, private car, and public transportation) swimming halls.
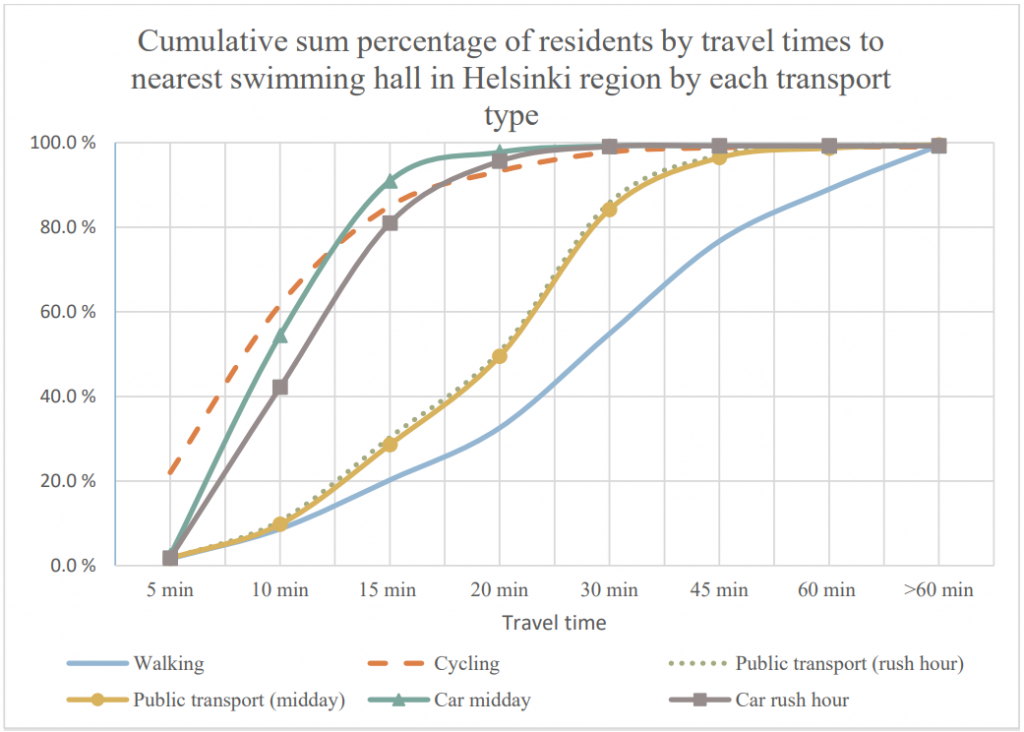
Results show that in the Greater Helsinki Region the service network of swimming halls and spatial accessibility to those are rather good; approximately 80% of the people are living within 13 minutes driving (by car or bicycle) to their closest swimming hall (see Figure 1). Almost all people in the Greater Helsinki Region can reach their closest swimming hall in 30 minute by private car. But unfortunately, when using public transportation not everyone can reach the facility in less than 60 minutes. Typically, there are some remote living areas with poor public transportation, but the majority of people living in the Greater Helsinki Region have good spatial accessibility to the swimming hall. But of course there might occur in reality other obstacles or passivity why dwellers can’t use or access the swimming hall, but Keurulainen’s study consentrated only to spatial accessibility, which tells about the potential situation.
In addition, one can see from the Keurulainen’s result map (Figure 2) – and which is also proved by Student’s t-test Keurulainen calculated (see Keurulainen’s result table in his thesis on page 40) – that in the City of Espoo (western part in the map in the Figure 2) wealthy and disadvantaged living areas are located almost evenly. This is indicated by the Keurulainen’s result that there does not occur any statistically significant difference between the most disadvantaged and the wealthiest living areas in travel times by walking and cycling (p-values 0.922 and 0.505, respectivelly). But, in the City of Vantaa and the City of Helsinki (eastern part and the centre part, respectivelly, in the map in the Figure 2), there occur statistically significant differences. In these two cities, many swimming halls are located near the most disadvantaged living areas (red areas in the map). These are mainly 40-50 year old sub-urbans with apartment houses from that era. Typically, disadvantage is concentrated in these areas due the segregation. The map of disadvantage sum index in the Figure 2 indicates that there occur segregation in the Greater Helsinki Region.

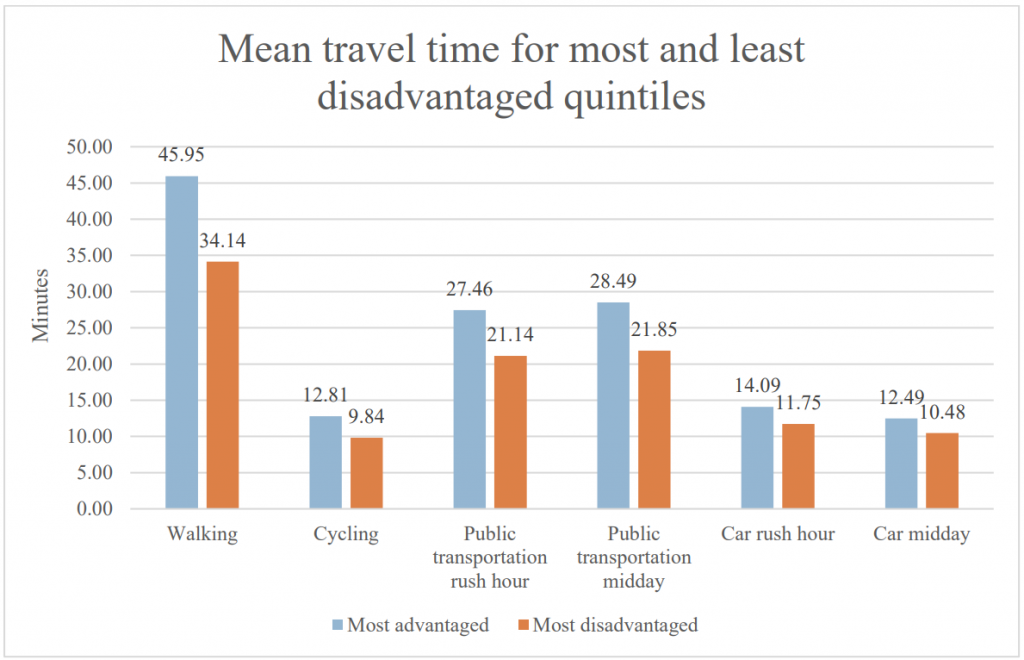
Luckily, these sub-urbans with concentrated disadvantage have better spatial accessibility to swimming halls (see Figure 3). To be precise, there occur statistically significant differences in average travel times to the closest swimming hall when comparing the most disadvantaged living areas and the wealthiest ones, but the most disadvantaged living areas have the lowest travel times.
It can be concluded that the spatial accesibility to swimming halls does not create injustice when considering dwellers’ rights and opportunitis for active and healthy life. Therefore, this not either strengthen the segregation in the area. Actually, people living in the most disadvantaged living areas had better spatial accessibility (i.e. shorter travel times) in average to their nearest swimming hall than people in the wealthiest living areas (see Figure 3). One can for example argue that remote wealthy living areas where people must own a private car and housing prices are higher have longer travel times to the nearest swimming hall.
Keurulainen’s thesis has been conducted in the research project “Yhdenvertainen liikunnallinen lähiö (YLLI)”. The YLLI project is funded by the Lähiöohjelma 2020-2022 coordinated by the Ministry of Environment. Permalink to the thesis: http://urn.fi/URN:NBN:fi:hulib-202201211072.