When you create spreadsheets or graphs, or calculate the values of columns and rows with a spreadsheet program, please be aware of the following:
- Before you create a spreadsheet, consider which items will be placed in columns and which on rows. Spreadsheets usually look better if there are more rows than columns (this also makes it easier to print the spreadsheet). In particular, if data will be added to the spreadsheet later, it will be more natural to add rows than columns. However, the exception often proves the rule, so always consider what is best for your purposes.
- When you write data on the rows, do not leave empty columns between the data.
- You can change the accuracy of numbers in the spreadsheet cells by changing the number of decimals shown. Changing the shown accuracy will not change the accuracy of the numbers used for calculation.
- It can be useful to use the formatting (background colours, borders, etc) to emphasize important items in a spreadsheet and make it easier to read, but it is best to avoid too much decoration.
- Although there are several kinds of graphs to choose from, it is usually best to pick a simple and clear one. A three-dimensional pie chart can look imposing, but it is seldom as clear as a bar chart.
- When printing spreadsheets it is best to use the preview feature to see if your spreadsheet will fit on one paper. You can also print only a part of the spreadsheet (by selecting the part you want to print).
- Sort the data in your spreadsheet in an appropriate way for your purposes (e.g. dates, names, variables, etc in descending or ascending order). Use the automatic sorting feature of the program.
- Your work will benefit immensely and be much quicker if you use relative references (read more in the chapter on cell references) and copy calculation formulas from one cell to another.
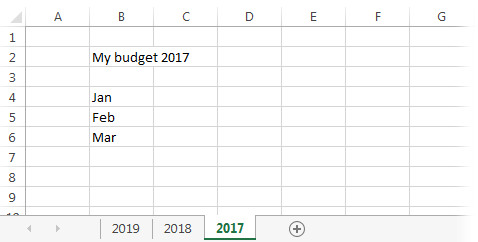
- You can save many spreadsheets in one spreadsheet file or workbook. This makes transferring data from one spreadsheet to another easier. Below is an image of a workbook containing three spreadsheets: